The evidence is clear: successful companies that create ongoing shareholder wealth are focused on the long term. Performance management processes and executive reward plans need to reflect this by avoiding the encouragement of short-termism, even inadvertently.
GRG Remuneration Insight 100
by Denis Kilroy and Marvin Schneider, The KBA Consulting Group
1 December 2017
The following article was written by Denis Kilroy and Marvin Schneider, principals of The KBA Consulting Group. While KBA is not a remuneration advisor its work in helping companies to understand, identify and implement value creating strategies has contributed to the discussion of the most appropriate design of variable remuneration for senior executive roles. This article summarises KBA’s views which may assist boards that are reviewing the elements of variable remuneration and the metrics used to assess performance.
Any questions may be directed to denis.kilroy@kba.com.au or marvin.schneider@kba.com.au.
Short-termism – and the Threat Posed by an Absence of Clear Thinking
In September this year, Palgrave Macmillan published our book Customer Value, Shareholder Wealth, Community Wellbeing. This book provides a roadmap for the Boards of listed companies that are seeking to build enduring institutions capable of creating value for customers and wealth for shareholders on an ongoing basis – and so prosper well beyond the tenure of the current executive leadership team. Central to the thinking presented were two significant breakthroughs – one conceptual and one research-based.
The conceptual breakthrough centred on the notion of a Bow Wave of Expected Economic Profits embedded in the share price and market capitalisation of every listed company at every point in time.
The EP Bow Wave construct provides the first meaningful and actionable bridge through which to link the product and services market performance produced by management, with the capital market outcomes experienced by shareholders.
The research breakthrough made use of the EP Bow Wave construct to explore how wealth is created on an ongoing basis by truly successful companies. The conclusions were very clear. Just over 60 percent of the wealth created by the 63 top performing companies in the ASX 100 that succeeded in creating wealth for their shareholders over the five years to 31 December 2015, came from increasing the sustainability of their businesses. Only 35 percent arose from improving the underlying economics of their businesses, in the form of increased expectations in relation to future economic profitability and / or growth. And in what will perhaps be a surprise to many, just 5 percent came from outperforming expectations over the five-year measurement period. The picture was even more skewed towards sustainability and long-term performance in the case of top performing companies listed on the New York Stock Exchange and the London Stock Exchange.
This understanding was unlocked by examining the change in the shape of the EP Bow Wave over the five years to 31 December 2015, for each of the top 100 companies by market capitalisation in each market.
So before going further, we need to explain the EP Bow Wave concept.
Understanding the EP Bow Wave
The EP Bow Wave is illustrated in Figure 1. Shaped like a child’s slippery dip or slippery slide, it is analogous to the bow wave of a ship moving through the ocean. A bigger bow wave denotes a ship that has built up greater momentum.
Figure 1. The Bow Wave of Expected Economic Profits
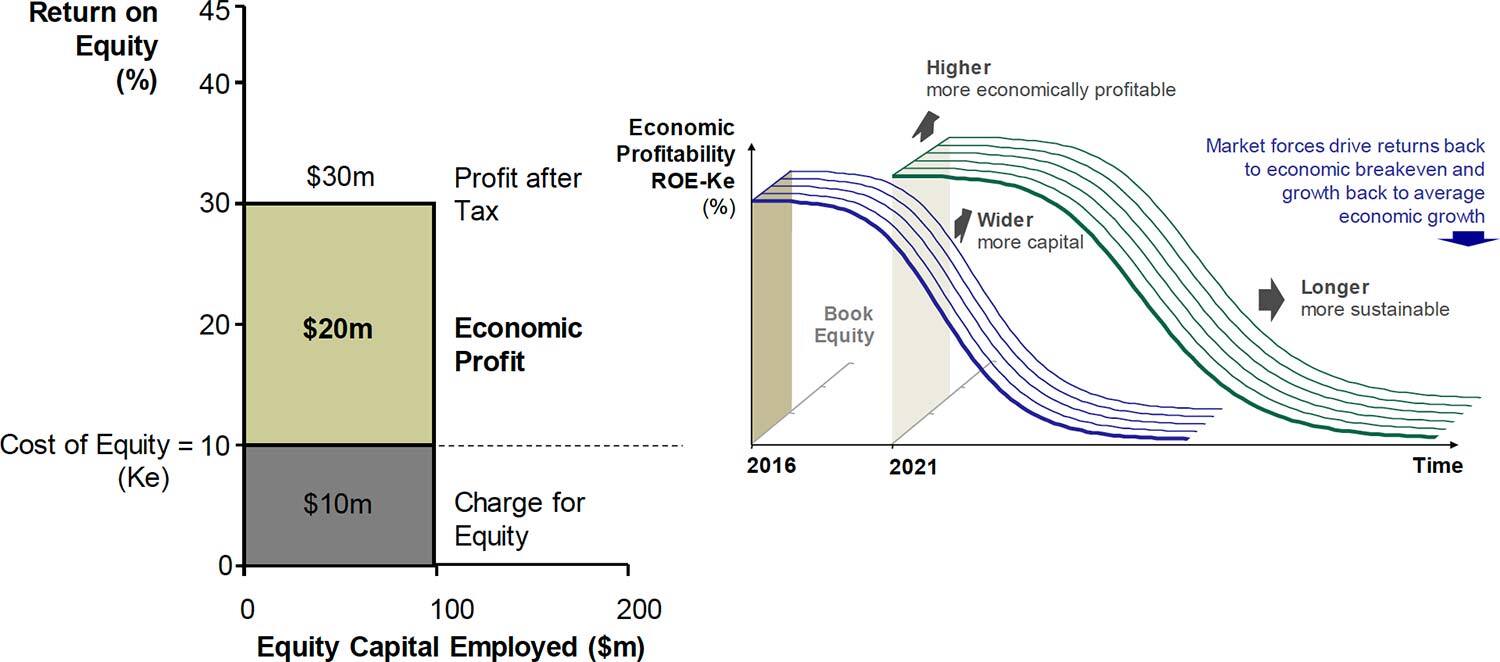
Shareholder wealth will be preserved in the capital market and TSR will equal the cost of equity capital (Ke), when a company delivers an EP stream consistent with the EP Bow Wave that was embedded in its share price at the beginning of a given measurement period. Wealth will be created(TSR > Ke) when management find a way to enhance the shape of their EP Bow Wave – making it higher with enhanced returns, wider through greater growth, or longer though actions that make the business more sustainable.
Understanding How Wealth is Really Created
One of the important realisations that emerges from the EP Bow Wave construct is that wealth is not created in the capital market simply by making returns higher in the product and services market.
Some companies include metrics such as ‘the compound annual growth rate in ROE’ in executive reward plans. But the EP Bow Wave suggests such metrics could encourage behaviour more likely to destroy shareholder wealth than create it.
It is not about making the EP Bow Wave higher with higher returns, but increasing the ‘volume under the slippery dip’. Making the EP Bow Wave wider and especially longer, can be much more important, particularly for companies that are already quite economically profitable.
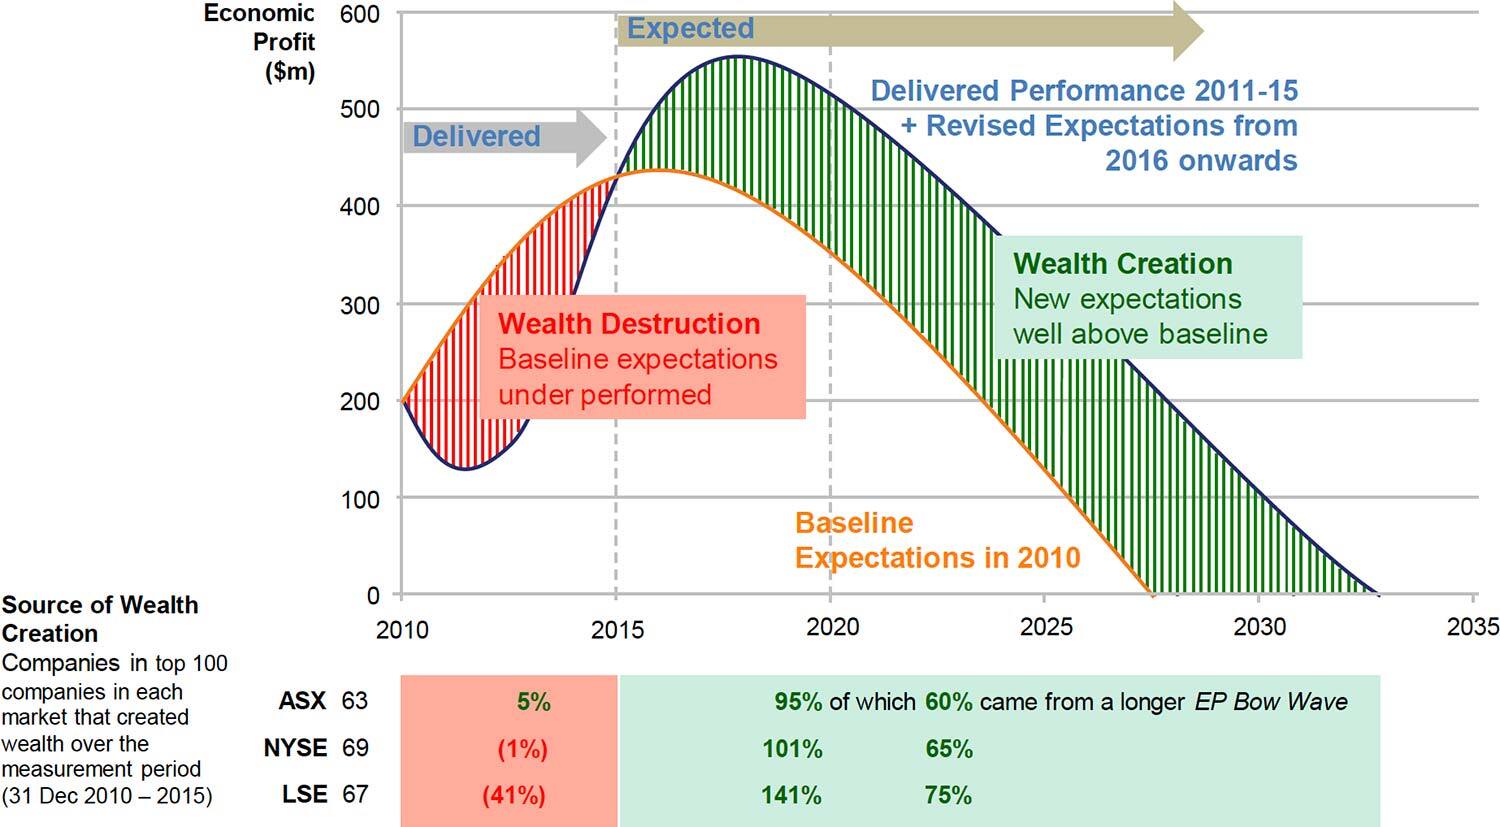
We can use a Pair of EP Bow Waves, constructed at the beginning and end of a measurement period, to identify and quantify the two sources of wealth creation that always exist for every listed company. The idea is illustrated in Figure 2 using a two-dimensional version of the EP Bow Wave, where the vertical axis is EP in dollars and is equivalent to the shaded planes in Figure 1.
Figure 2. Sources of Wealth Creation in Successful ASX, NYSE and LSE Companies – Five Years to 31 Dec 2015
The two potential sources of wealth creation will always be:
- The wealth created by delivering an EP stream that exceeded the expectations in place at the beginning of a given measurement period (the red area is Figure 2, in this case representing wealth destruction by failing to meet expectations), and
- The wealth created from any increase in expectations during the measurement period, in relation to the EP to be delivered beyond the measurement period (the green area in Figure 2).
When we examine performance over time using the Pair of EP Bow Waves, we find that for more successful companies, the wealth created from establishing new and higher EP expectations to be delivered in the future, is far more important than that arising from exceeding existing expectations.
Successful companies create wealth by creating capabilities and harnessing innovation to devise better customer value propositions and to develop higher value strategies. These lead to a series of new and higher EP expectations to be delivered in the future. Successful companies then deliver, or go close to delivering, these new and higher expectations. But they tend not to exceed existing EP expectations over the short-to-medium term – and certainly not to any great degree.
Each of the studies we have conducted in the ASX, the LSE and the NYSE shows that in general, the more successful a company is in continually creating shareholder wealth over time, the higher the proportion of the wealth they create that comes from establishing new and higher EP expectations to be delivered in the future, and the greater the proportion of this that comes from making their business more sustainable (with a longer EP Bow Wave).
Figure 3 summarises the results of a quite recent study of the largest 120 ASX-listed companies by market capitalisation (excluding resources companies and REITs) divided into three groups; top performers, good performers and relatively poor performers. In this case, we looked at the aggregate wealth creation for five rolling three-year periods throughout the seven years to 31 December 2016. Figure 3 shows the elements of the wealth creation outcome in percentage terms.
Figure 3. Sources of Wealth Creation in 120 ASX Listed Companies– Seven Years to 31 Dec 2016
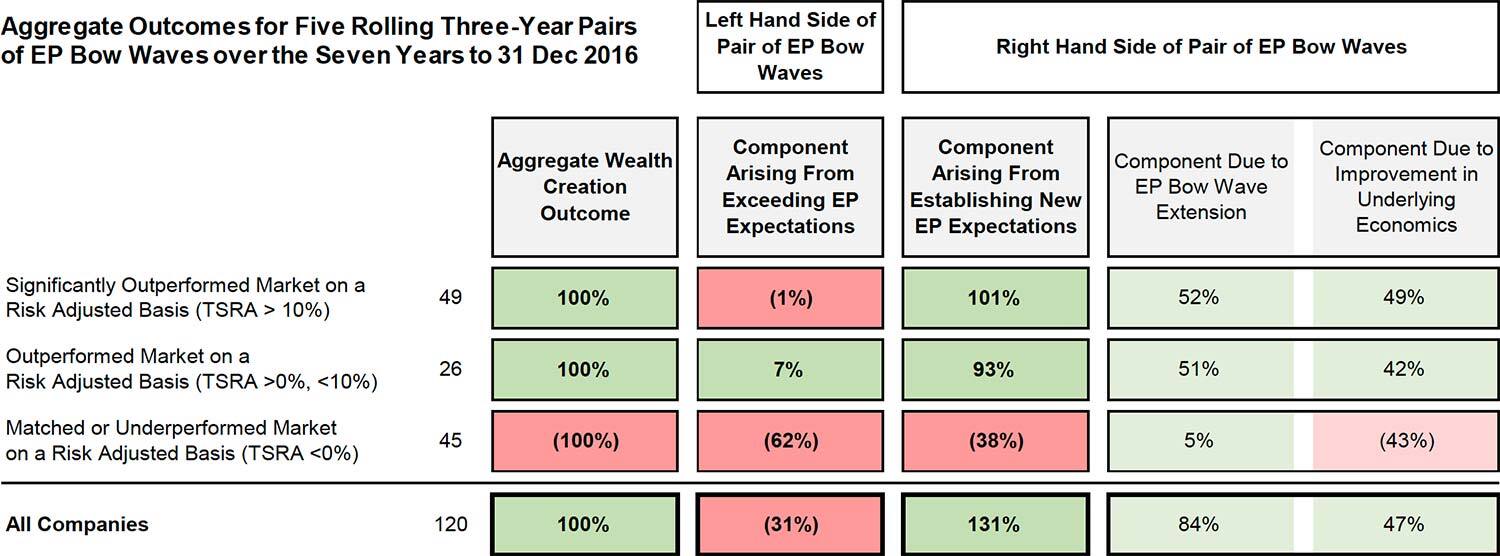
For the 49 ‘top performing’ companies, whose management teams made a significant contribution to the wealth creation outcome experienced by shareholders, all the wealth created came from establishing new EP expectations to be delivered in the future. More than half of this came from enhancing the sustainability of the business, or from increasing the length of the EP Bow Wave.
For the 26 ‘good performers’, whose management also made a material contribution to the wealth created for shareholders (after stripping out the impact of market movements that had nothing to do with the efforts of management), 93 percent of the aggregate wealth creation came from the establishment of new EP expectations. Again, more than half of this came from an increase in the length of the EP Bow Wave.
The Problem of Stretch Targets
This understanding calls into question the focus on ‘stretch targets’ we see in most executive reward plans and which underpin the budgeting and performance management processes in many listed companies. It casts quite a shadow over the recent shift in thinking to move away from LTIs in favour of much larger STIs incorporating deferred equity, in which stretch targets will play an even more prominent role.
Stretch targets challenge management to extract more earnings from a business than its strategy was intended to deliver.
In imposing stretch targets, and then asking management to pursue them, a Board runs the risk of encouraging the destruction of shareholder wealth (albeit inadvertently) through underinvestment, by eroding the value of the company’s franchise with its customers, and by harming other non-shareholder stakeholders. In an enduring institution that is able to create value for customers and wealth for shareholders on an ongoing basis, all legitimate stakeholders need to be regarded as allies in the creation of customer value and shareholder wealth over the long term; not as adversaries in the pursuit of stretch earnings or EPS targets over the short-term.
The problem with stretch targets is exacerbated by the fact they are usually expressed in terms of accounting-based measures. Earnings, EPS and EPS growth are the most common measures. Their use further increases the risk of short-termism, due to widespread adherence to the EPS Myth.
The EPS Myth
Over the years, there have been many studies demonstrating that these three metrics (and others like them) are poor indicators of management performance because they can all be ‘bought at any price’.
Their use in justifying acquisitions because they are ‘earnings accretive’ or ‘EPS accretive’ can be particularly problematic.
The amount and the cost of the capital required to underpin an earnings or EPS outcome is not captured in earnings, earnings growth, EPS or EPS growth. Similarly, the widely held view that expressing earnings on a per share basis with EPS will normalise it for the additional capital required is simply not true. New shares required to fund growth are issued at market value not book value. Consequently, earnings and EPS move in lock step – as is demonstrated in Appendix 1 of Customer Value, Shareholder Wealth, Community Wellbeing. To the extent that there is any divergence at all between earnings growth and EPS growth, it arises because new shares might at times be issued at a slight discount to market value in a placement. But the impact of this is not significant.
As a direct consequence, the relationship between EP growth and TSR is an order of magnitude stronger than the relationship between EPS growth and TSR. The relationship between EP growth and TSR Alpha is even stronger – as illustrated in Figure 4 below.
Figure 4. The Strong Relationship Linking EP per share With TSR and TSR Alpha

Source. Kontes, Peter; The CEO, Strategy and Shareholder Value, Wiley, NJ, 2010; KBA Analysis
Figure 4 captures the results of two studies. One was completed by former Marakon CEO Peter Kontes (dec.) and a team from the Yale School of Management. It covered S&P 500 companies over the ten years to 31 December 2007. The second was done by KBA and covered ASX 300 companies over the five years to 30 June 2013. In both cases, the difference in annualised TSR between companies whose EP per share growth was significantly greater than their EPS growth, and companies whose EPS growth was significantly greater than their EP per share growth, was more than six percentage points. The difference expands to nearly 11 percentage points when we use TSR Alpha, which is a more appropriate indicator of relative performance over these timeframes.
TSR Alpha
To build a meaningful bridge between the product and service market performance produced by management and the capital market outcomes experienced by shareholders, we must use economic measures. It is impossible to construct this bridge using accounting measures to assess product and service market performance, in conjunction with non-economic capital market metrics like TSR and ranked relative TSR.
The reason we can build this bridge is because the economic performance benchmark in both markets is the same if we use economic measures. It is the cost of equity capital Ke. Book value is preserved in the product and services market when ROE matches Ke. Market value is preserved in the capital market
when TSR matches Ke.
At least initially, the measure of success in the product and services market is to be economically profitable with an ROE greater than Ke. However, once a business is economically profitable, the goal transitions to the pursuit of a growing and more sustainable EP stream. The three drivers that underpin that growing EP stream are the three dimensions of the EP Bow Wave. So, the focus should be on making the EP Bow Wave higher through enhanced returns, wider through greater growth, and longer through making the EP stream more sustainable.
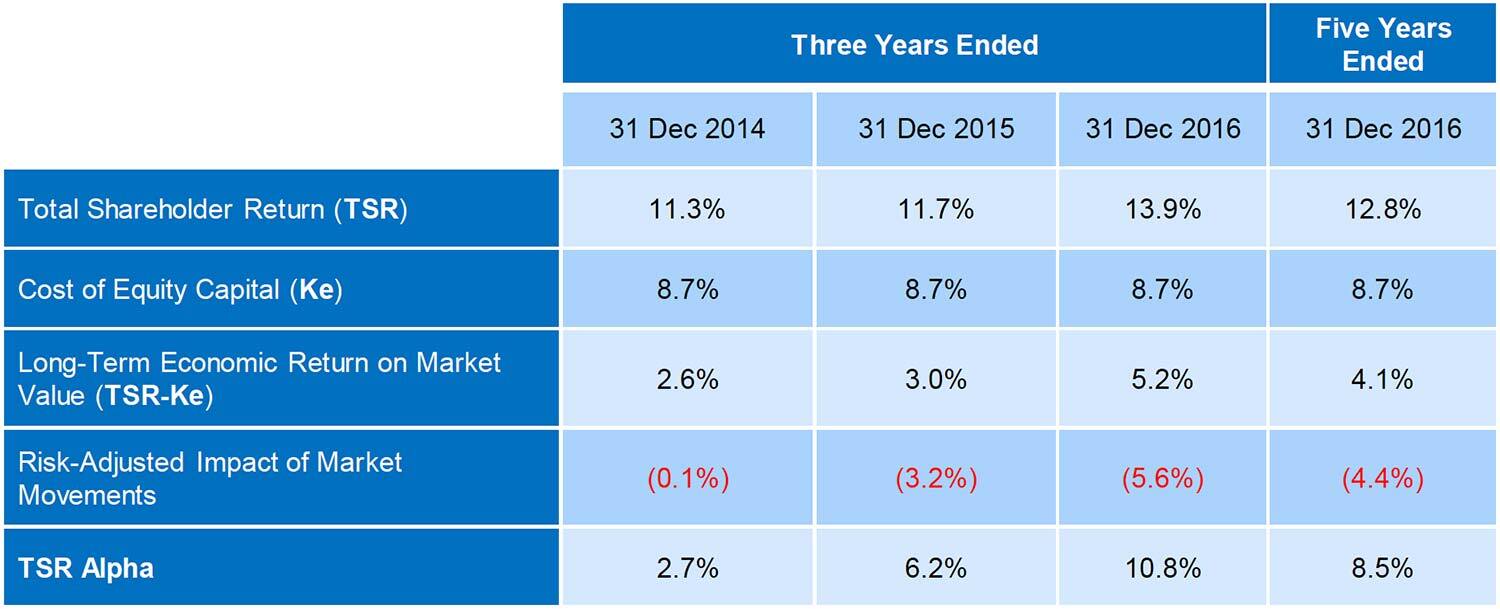
On the other hand, capital market success is measured with TSR-Ke over the long term (15-20 years or more), and with TSR Alpha over the short-to-medium term. Over any measurement period, these two measures are linked by the following relationship.
TSR-Ke = Risk Adjusted Impact of Market Movements + TSR Alpha
The Risk Adjusted Impact of Market Movements has nothing to do with the efforts of management. TSR Alpha is driven primarily by the market’s reaction to the decisions made and the actions taken by management.
The market expects TSR-Ke to converge to zero over the long term. It expects TSR Alpha to converge towards zero over the short-to-medium term. In both cases the benchmark performance is zero, indicating wealth preservation. A TSR-Ke of zero means wealth was preserved for shareholders. A TSR Alpha of zero means that management’s contribution tended to preserve shareholder wealth, independent of the impact of market movements.
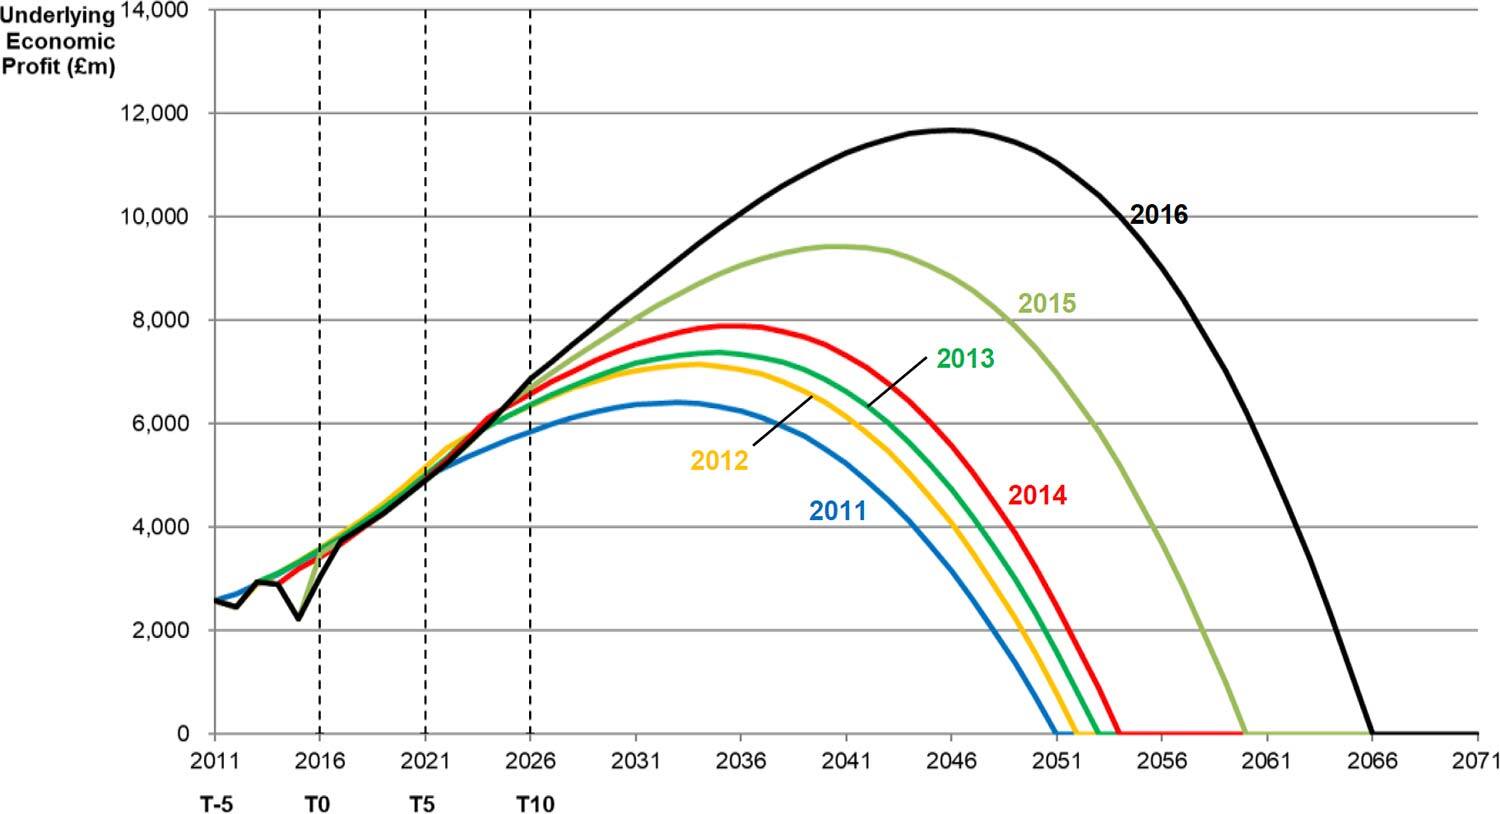
Businesses that succeed in creating wealth for shareholders on an ongoing basis tend to systematically enhance their EP Bow Wave profile by making it higher, wider and especially longer over time. They do this by meeting (or going close to meeting) EP expectations in the short term, while at the same time creating new and higher EP expectations to be delivered in the future. They then deliver the new expectations, while creating a further series of new and even higher EP expectations to again be delivered in the future. And then they do this again and again, as is illustrated Figure 5 in the case of Unilever.
Figure 5. Progression of EP Bow Waves for Unilever – as at 31 December from 2011 to 2016
In all listed companies, shareholders experience a return (TSR) and a wealth creation outcome (TSR-Ke). Each measure is affected by the efforts of management and the impact of underlying market movements. TSR Alpha represents the component of the wealth created for shareholders (TSR-Ke) arising largely from the actions of management.
Systematic action taken in the product and services market that leads to a steady improvement in the profile of the EP Bow Wave, will tend to produce a positive TSR Alpha outcome in the capital market – as illustrated in Figure 6 for Unilever.
Figure 6. Wealth Creation TSR Alpha Outcome for Unilever
Synthesis
The evidence is clear. Successful companies that create wealth for shareholders on an ongoing basis do it by focusing on the long term. They create new capabilities and harness innovation in an effort to enhance both the value they provide to customers and the wealth they create for shareholders. This translates into the continual establishment of new and higher EP expectations which they then deliver over time. They tend not to focus on trying to exceed expectations over the short term.
Performance management processes and executive reward plans need to reflect and reinforce this understanding. That means avoiding the use of stretch targets. It also means avoiding the adoption of any reward plan design that might tend to encourage short-termism – however inadvertently.
Consequently, the recent emergence of new reward plan designs that discard LTIs in favour of much larger STIs should be approached with caution. These new structures tend to emphasise short-term performance in the first instance. They use accounting metrics to assess short-term performance, and they then use a combination of disconnected accounting and non-economic capital market metrics (like ranked relative TSR) to determine how the component of any STI award that is subsequently put at risk will vest over time. This mechanism will tend to promote short-termism – albeit inadvertently.
Action taken to push up returns in the short term can and often does have a negative effect on the shape of the EP Bow Wave. When it does, it can undermine the ability of a management team to create shareholder wealth both now and in the future. This issue was discussed in some detail in an address to the GIA national conference in 2015.
Short-termism, or the pursuit of short-term financial performance outcomes at the expense of longer-term value creation, makes no sense at all. It exists because of a lack of clear thinking born of an incomplete understanding of applied corporate finance and the economics of listed companies. Boards should do everything they can to avoid creating conditions that encourage it.

