Do you need tailored remuneration advice this year, or just an update of market data and movements? Using real, current market data, we illustrate the differences between the approaches, and how you might decide which is best for your business at any given time.
GRG Remuneration Insight 141
by Denis Godfrey, James Bourchier & Peter Godfrey
19 July 2022
It is that time of year when most companies are reviewing remuneration for all employees, including KMP (executives and directors), to ensure the business can retain and compete for talent, while managing “strike risks” (votes against the Remuneration Report) and complying with the Corporations Act requirement for executive and director remuneration to be “reasonable”. One of the questions that is often left until the last minute is “do we need tailored advice, or just an update of market data and movements this year?”
In this Insight we explore this question with real/current market data to show the difference between the approaches, and how you might decide which approach is best for your business at any given time. While GRG’s database is composed of listed company market data, unlisted companies can still undertake benchmarking on the basis of revenue, or company valuation.
Internal assessment or external advice?
Depending on the company, it may be appropriate to assess the competitiveness of Executive or Board Remuneration internally or use external capabilities from independent advisors to effectively manage the risks associated with remuneration strikes or loss of talent due to an uncompetitive pay strategy. Many companies undertake an initial internal review, where market data and analysis are required, so key parties undertaking the review can understand if the current strategy is appropriate and aligned with the company remuneration policy.
Further, if the data suggests that remuneration is not aligned then a more formal review may be appropriate where additional capabilities are sources from an external expert provider where formal independent advice and recommendations can be obtained.

How do I know which benchmarking approach is right for my next remuneration review?
There are typically three alternatives for benchmarking and assessing the appropriateness of remuneration, including market competitiveness, for any role(s). Two approaches enable internal or self-assessment, using market data, (“data-only”) and the third is the tailored advice and recommendations as part of seeking external independent advice.
Internal assessment with market dataThis may be triggered by:
| |
Sense-checking with off-the-shelf market dataGRG’s annually published KMP Remuneration Guides are an excellent starting point in examining market data. Ordering a Guide involves selection of a market sector and sub-cuts, as well as choosing two revenue or market capitalisation ranges. In the example below, the market capitalisation of interest falls closest to the middle of the $375m to $750m standard range. The data cut will be “All Industries”, but broad pre-defined sub-sectors will also be shown and examined. | |
Self-assessment with deeper investigation using bespoke sample market dataA comparator group of around 20 companies is typically selected to provide the most appropriate possible benchmark for executives. This typically involves setting a range around the target company value (usually half to double); ensuring the group is balanced so measures of central tendency are valid and reliable; and selecting companies with as many similar features as possible. | |
| . | |
Formal review with independent external adviceThis is usually triggered by:
| |
Tailored advice & recommendationsUnder this approach, several of the foregoing methods may be combined to build a customised model of the market relevant to your business, and a customised model of your role designs, to provide adjusted recommendations specific to your organisation design and circumstances. GRG provides this in a remuneration benchmarking advisory report. | |
Often an internal assessment option is a critical step to determining whether tailored advice and recommendations may be needed, and are not exclusive from it. If internal assessment or sense checking indicates that pay is out-of-line with the market, strike risk management might need to be considered, and/or the impact of the design of the role or the organisation specific role relationships may need to be used to determine whether the benchmark is directly comparable, or may need to be adjusted to recognise variations in these factors compared to standard market role designs and relationships.
Comparison of self assessment approaches
|
|
 [Tap or click image to enlarge] | 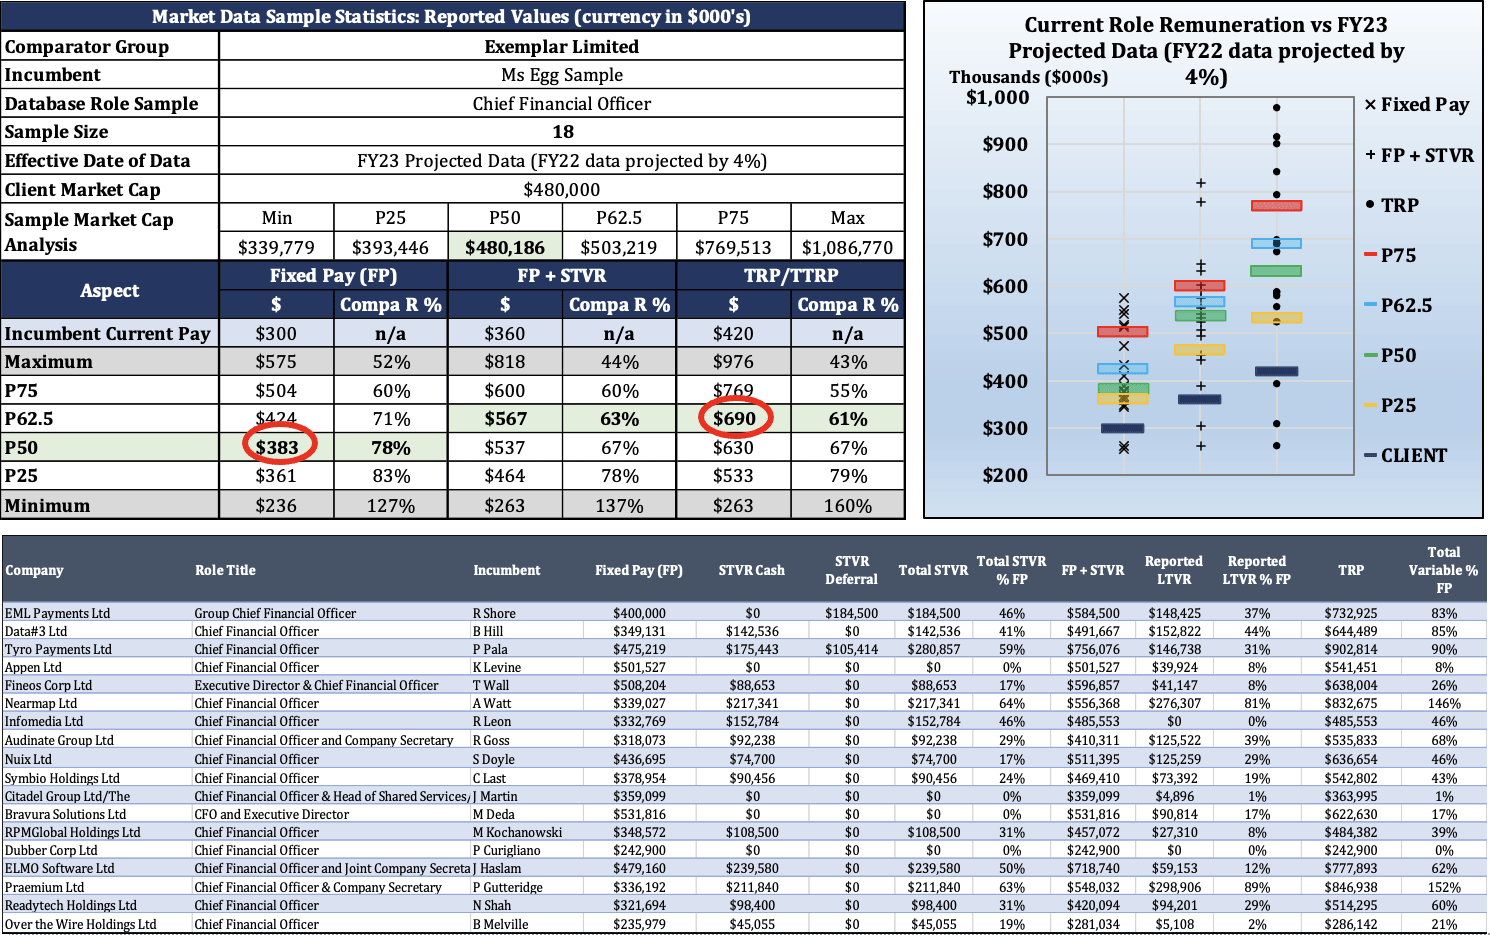 [Tap or click image to enlarge] |
| Typical roles covered Typical top executive and non-executive director roles observed and disclosed by ASX listed companies (standard title matches only). | All roles covered Any KMP Role you wish, including the rare ones that require specialised “data mining” to obtain a sample. |
| Self role matching Standard title matching with roles listed in the Guide – see the roles list for the All Industries Guide example here. | Roles matched by GRG GRG will match any role you are benchmarking with role classifiers from the database to provide the most meaningful sample. If there is no clear match, we will undertake “data mining” to obtain a sample. |
| Low cost A GRG Remuneration Guide costs $3,500 + GST. | Higher cost This example cost $12,000 + GST for the 4 roles in this scenario. |
| Immediate result Delivered within 24 hours. | Longer to produce Typically takes around 2 weeks. |
| Customised remuneration data tables Standard remuneration data tables representing pay practices of companies similar in scale to yours, based on market capitalisation or revenue ranges selected, industry and sub-sector cuts selected. | Bespoke sample & analysis GRG can assist you to select a group of companies that are likely to produce the most valid and reliable benchmarking result for your business. |
| Not balanced and could be “skewed” towards companies that are larger, smaller or otherwise not comparable, depending on where your business falls within the selected range, and how the data role sample is distributed within the range. | A balanced outcome that has been checked by analysts and consultants as being free from anomalous outcomes and a reasonable and appropriate indicator of market remuneration. All tailored data sets undergo multiple levels of data checking and peer review to ensure a tailored, appropriate reference point for your business. |
| No transparency on line-by-line data Can’t check for outliers or exceptional data points (statistics do not show this information). | Full transparency on line-by-line market data allows you to check not only for anomalies or companies you may wish to exclude, but also to examine the market practices of particular peers and see the precise breakdown of packages for each role in each company. |
 Internal assessment: an example scenario
In this fictitious example it is assumed that all directors and executives in a technology company, Exemplar Limited (market capitalisation of $480m at end of June 2022), are the subject of a remuneration review, however, we will focus on the Chief Financial Officer (CFO) only, to limit the scope of the discussion. In this scenario the Company is struggling to compete for talent in the technology sector, where peers are often offering equity as part of Fixed Pay. The Exemplary Limited CFO currently only makes a minimal strategic contribution because the CEO’s role includes financial strategy in this Company’s role and organisation design. The CFO is currently paid:
- $300,000 in Fixed Pay (Salary, Super, Allowances, Benefits, FBT and Fixed Pay Equity),
- 20% ($60,000) in Short Term Variable Remuneration (STVR) at Target (Stretch/maximum of $67,500) and
- 20% ($60,000) in Long Term Variable Remuneration (LTVR) at Target (Stretch/maximum of $60,000 valued at grant);
- the Target Total Remuneration Package (Target TRP or TTRP) of the incumbent is therefore $420,000.
- The Company’s remuneration policy, as per the Executive KMP Remuneration Policy & Procedure published on the Company website, is to pay Fixed Pay at P50 of the market, and Target TRP at P62.5, subject to adjustment for role design and incumbent specific factors.
The two first approaches display some markedly different features and may lead to very different outcomes with notably different costs to the Company:
 Off-the-shelf data
[Tap or click image to enlarge]
Indicated at a high level whether or not the current packages in “in-the-ballpark”. In this case, it showed that the incumbent was being paid substantially below the benchmarks (both the red and yellow circled values above) and should be the subject of a remuneration adjustment, to around $456,000 Fixed Pay and $835,000 TTRP, based on the Industrial & Service Sector data, which would appear to be most relevant (yellow circled values above).
 Tailored market data
[Tap or click image to enlarge]
This approach gave a much more precise indication of pay practices in the technology sector for comparably scaled businesses, including key peers, and showed that the broader Industrial & Services market data was overestimating the benchmark. Instead, it appears $383,000 Fixed Pay (P50 FP) and $690,000 Target TRP (P62.5 TRP) would appear appropriate, saving the Company around $73,000 in Fixed Pay and $145,000 in total cost in FY23 compared to using the broader market indicators.
 Seek independent external advice: benchmarking advisory report
Tailored advice & recommendations
While the foregoing examples are “data only” and can be provided to anyone, recommendations can only be legally given to non-executive directors in listed companies. In this example, after the client sense-checked their remuneration with the Guide, and then obtained the bespoke data-only report, the Board decided to engage GRG to provide tailored advice in a benchmarking advisory report, which proceeded as follows:
- GRG built a tailored pay-banding model across the whole executive team, reflecting market-anchor points from the data-only report, and then built a customised model of the organisation design based on role descriptions, the organisation chart, and discussion.
- This resulted in “slotting” of roles relative to a) typical market positions and b) other executives inside the Company. In this case, the CFO role was identified as being “a step down” from a typical CFO role, because the CEO role had taken the financial strategy accountability from the CFO role, and was slotted one position below the typical CFO position.
- This led to a recommendation for the incumbent to receive $330,000 in Fixed Pay, alongside a 35% Short Term Variable Remuneration target, and a 35% Long Term Variable Remuneration target expectation (note: target is not stretch/maximum).
- The resultant total package of $561,000 fell low in the data range, but represented a significant increase on the current package, which retained the incumbent, and was appropriate to industry, company scale, the company’s specific role design and role relativities.
- Further, GRG recommended that the 10% Fixed Pay increase be delivered in the form of 12-month-tested Service Rights (as part of Fixed Pay), to reduce cash-flow impact, support retention, and to compete with peers offering additional equity in the technology space.
- Similarly, it was recommended 50% of the STVR be settled in Restricted Rights (no “risk of forfeiture” but subject to clawback and favourable tax treatment) to reduce the cash-flow impact of variable remuneration increases, while increasing “skin-in-the-game”.
Conclusion
There will be times when each of the available benchmarking approaches will be appropriate to your circumstances. Typically, tailored advice is only sought every 2–3 years or if circumstances have changed substantially e.g. >25% change in market capitalisation, major change in organisation design or role design, or critical feedback from stakeholders is received. In between major reviews, off-the-shelf solutions like the Guide can tell you which way the wind is blowing, and if you might be materially out-of-the-market.
While tailored advice can help get you to the right outcome faster and more efficiently than interpreting market data yourself, you may prefer not to receive recommendations or perhaps a data-only check give you the comfort you need. In this case data-only or off-the-shelf reports will be the best solution for you.
Our special offer lets you make a direct comparison
For a limited time GRG is offering both off-the-shelf and bespoke benchmarking* data alternatives described in this Insight as a bundle, so that you can make a direct comparison to use in your remuneration review. This offer includes a tailored benchmark for one executive KMP role of your choice (except for MD/CEO) and a GRG KMP Remuneration Guide.
Only $3,500 + GST