
Benchmarking executive pay at stretch rather than target is a growing trend and how it quietly lowers remuneration opportunities. Explore the paradox, its effect on equity grants, and why target-based benchmarking works better.
GRG Remuneration Insight 189
21 September 2026
The Rise of Stretch Benchmarking – and Why It Is a Problem
 A inexplicable emerging trend in executive remuneration benchmarking is the use of stretch or maximum remuneration outcomes as the reference point for benchmarking, instead of target remuneration. GRG has seen growing interest in this approach among clients familiar with benchmarking services and databases offered by other providers, despite the fact that maximum outcomes should occur only infrequently under a properly designed incentive plan. As this article explains, benchmarking on a stretch basis creates significant analytical and governance challenges and is fundamentally constrained by the way one type of common performance metrics is treated, and it is not what anyone would expect. The result is a paradox: benchmarking at stretch often leads to lower remuneration benchmarks than benchmarking at target, because measures with no stretch component drag down market benchmark statistics, understating remuneration opportunities when compared to properly scaled and calibrated outcomes. Stakeholders should always be sense checking whether market data is statutory, target, or stretch, with both statutory and target market data being superior to stretch. Where stretch is referenced, the methodology should always be interrogated so that appropriate consequent adjustments can be made when setting pay. While GRG makes stretch data available to clients, we always caution against using it for the reasons we demonstrate with a live example, in this Insight.
How Target and Stretch Remuneration Work in Practice
Executive total remuneration packages (TRPs) are typically composed of three elements being Fixed Pay (salary, allowances, super, benefits and fringe benefits tax), short term variable remuneration (STVR), also known as short term incentive (STI) and long term variable remuneration (LTVR) also known as long term incentive (LTI). Being market competitive in relation to Fixed Pay is important but will not alone achieve the primary remuneration objective of attracting, retaining and aligning top talent if the other elements do not deliver a market competitive TRP when added to Fixed Pay.
Market competitive is typically a reference to the median/middle of market practice. In this regard it should be noted that it is the TRP that needs to be market competitive, and not each element taken in isolation. When companies look at each element separately and align each element to the median of market practice for the element, it inevitably produces TRPs that are not aligned with the median of market practice for TRPs. If averages were to be used, then using the average for each element will produce an average TRP. The use of averages in benchmarking executive remuneration is generally avoided because market data samples are relatively small and susceptible to skewing which makes averages less reliable as an anchor point than median outcomes which are not skewed by outlying data.
Data used for benchmarking TRPs and each element of variable remuneration is ideally benchmarked around policy data, so that the data is not impacted by actual performance outcomes. Policy-based remuneration benchmarking will usually address two levels for each element of variable remuneration being target and stretch. Target variable remuneration aligns with performance that is expected (often expressed as challenging but achievable, often associated with budget outcomes) whereas stretch variable remuneration aligns with performance that is exceptional and would be expected to be achieved rarely.
Market data based on actual variable remuneration outcomes can also be used since when taken in aggregate over a large sample, target tends to be the dominant outcome in the sample, but care is needed due to such outcomes being influenced by performance and tenure. Performance can be influenced by economic conditions and produce high variable remuneration outcome in boom times and low variable remuneration outcomes in challenging times. Both scenarios were evident during the Covid pandemic when some sectors experiencing boom times and others struggled to hold performance at breakeven levels. This volatility mainly affects STVR.
The reported LTVR values disclosed by listed companies are less influenced by economic conditions and more affected by tenure. The reported values of LTVR elements where performance is measured by reference to shareholder value tend not to change with actual performance outcomes. However, for those elements where performance is measured by reference to other measures such as Earnings Per Share (EPS), the values do changes to reflect performance. Also, when LTVR values are spread over a number of years the reported LTVR values will lag policy until the number of LTVR grants equals the number of years over which the LTVR value is reported.
CFO Remuneration Example: Target vs Stretch Benchmarking ($500m-$1b Companies)
The following bar chart presents market data for the role of CFO in companies with market capitalisations between $500 million and $1 billion (note: Fixed Pay is abbreviated to Fixed Pay):
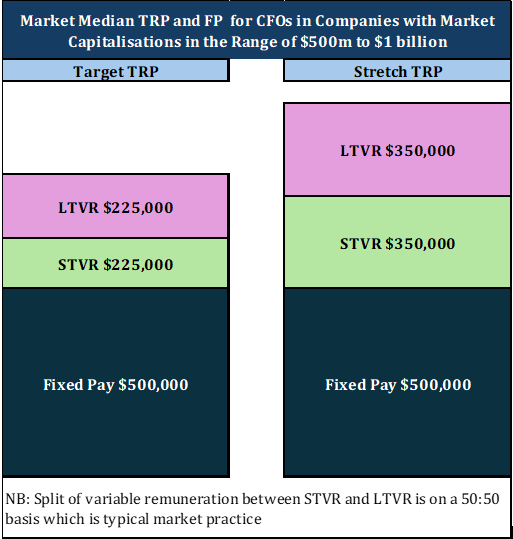
In this model the Fixed Pay and the TRP have been set at median market practice, while we have split STVR and LTVR elements out of the total variable pay (the gap between the Fixed Pay median and TRP median) on a 50:50 basis, which is consistent with market practice for direct report roles. The data has been rounded for illustrative purposes.
Why Stretch Benchmarking Produces Lower Variable Remuneration Opportunities
Although it may be counterintuitive, basing STVR and LTVR opportunities on stretch outcomes provides executives with lower variable remuneration opportunities.
Most STVR plans set the stretch award opportunity at between 150% and 200% of the target award opportunity (or put the other way, most target STVR opportunities are one half to two thirds of the maximum). Applying these relationships to remuneration profiles based on a target or stretch benchmarked policy produces the following outcomes. Using this example, the maximum STVR award opportunity under a stretch-based benchmarking policy (i.e. where target is broken down from the stretch benchmark) is $350,000 which is low in the range that results from applying the target benchmarked policy, being between $337,500 and up to $450,000 (where stretch/maximum is built up from a target-based benchmark):

In LTVR plans the most commonly used stretch award opportunity is 200% of the target award opportunity (or put the other way, target vesting is almost invariably 50% of the stretch/maximum). Different (higher and lower) stretch percentages tend to be frowned upon by various stakeholders. The following table again illustrates that policies based on stretch benchmarking produces lower LTVR award opportunities than those where policies are based on target benchmarking.

The only exception is where metrics are binary such as milestones, because there can only be achievement or non-achievement. In these cases, target is equal to stretch. The presence of binary metrics is often overlooked and goes to the heart of why benchmarking at stretch/maximum is generally unreliable or even invalid. When a component of short or long term variable remuneration is either “achieved or not achieved”, which can apply to milestone conditions, service based conditions, meeting a “meets expectations” performance rating or any other number of metrics where a scale is absent or inappropriate, target is also the stretch/maximum. A database of stretch/maximum benchmarks faces an impossible choice: either exclude such metrics (usually impossible or would make the sample useless) or treat the binary target reward as if it was the same as stretch rewards, even though it has a much lesser level of difficulty, lesser reward/value, and is actually not comparable to other stretch metrics. In this way, stretch benchmarking ends up conflating and mixing target performance and reward with stretch/maximum performance and reward; this inevitably drags the benchmark downward. As a result, stretch-based policy benchmarking will always produce confused results with suppressed statistical values. This also highlights the importance of understanding the nature of different metrics, and scaling them, when setting remuneration; particularly, calculating grants of equity.
Equity Grant Calculations: Why Stretch Policies Cause Governance Errors
Companies from time to time wish to change the performance metrics used to determine vesting of different tranches of LTVR grants. If a target policy is used then appropriate numbers of equity instruments (shares, rights options) are granted whereas if a stretch policy is used then changes to the performance metrics can lead to inappropriate numbers of equity units being granted.
Following are the formulae used to calculate stretch grant number for LTVR purposed under different remuneration policies:
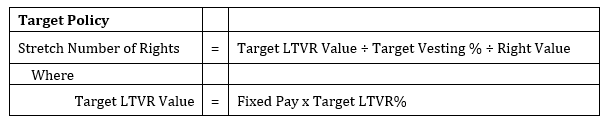
This calculation determines the grant number at the stretch/maximum level and ensures that when target performance is achieved the target number of Rights vest such that the remuneration outcome will fall at intended benchmark position in the market. It also ensures that above and below target performance results in vesting that is consistent with the performance achieved, scaling up or down around the benchmark.
When remuneration policies are aligned to the stretch market data the following formula is used to calculate the stretch grant:

However, this approach is problematic as illustrated in the following example, and is the most common cause of error in equity governance we observe.
In the example it is assumed that:
- the target and stretch outcomes for combined STVR and LTVR from market data are $450,000 and $700,000, respectively,
- The Fixed Pay is set at $500,000 being the market median,
- The amounts available for STVR and LTVR are $225,000 under the target data and $350,000 under the stretch data – it is typical of market data for the uplift from median Fixed Pay to the stretch TRP to be less than double the uplift from median Fixed Pay to the target TRP for the reasons noted earlier, and
- The mix of STVR and LTVR is on a 50:50 basis irrespective of whether target or stretch market data is being used. This is a commonly accepted mix of STVR and LTVR for senior executives who report to the CEO.
- Applying the target and stretch based formulae produces the following grants at the stretch level. Two examples have been used for the target approach to demonstrate the sensitivity of the target approach to different target levels of vesting, or binary metrics. The stretch approach has no sensitivity to various target levels of vesting or binary metrics.

Now the maximum/stretch-based grant calculation example:

Under the target approach 11,250 equity units vest when target performance is achieved, while the outcome may be up to 22,500 at maximum. However, under the stretch approach 17,500 Rights will vest if target vesting is 100% (binary vesting) or 8,750 vest if target vesting is 50% (assuming a scaled metric was adopted). The lack of sensitivity to target vesting percentages in the stretch approach will always result in the number of Rights that vest being inconsistent with the company’s policy and target market benchmark, and as reflected in the target vesting percentage.
Note that fewer equity instruments are granted when a binary metric is used because there can be no out performance of the performance target, in which case the calculation should be the same under either approach since Target=Stretch/maximum for binary metrics, and either all or none will vest:

This means that when binary and scaled metrics are mixed, only the target-based calculation methodology can produce the correct weighting; GRG often observes statements about intended equity weightings, often in annual reports where one of three metrics is binary, and an error is made either in the grant calculation or statements regarding the intended weighting/focus (which is intended to reflect the relative importance of the metric).
Why Boards Should Anchor Remuneration Policy on Target Market Data
Based on the example it follows that Boards that are genuinely seeking to attract and retain the top talent should adopt a remuneration policy that is based on relevant target market data and provide additional reward opportunities for outstanding performance that exceeds expectations. Stretch based remuneration policies may lead to less competitive remuneration policies. To appropriately govern this, GRG recommends that the Board articulate a policy for calibrating the difficulty of vesting hurdles, against intended market data positioning. While this is not an exacting science due to the difficulty of predicting the future, having such a framework goes a long way to ensuring that most of the time, the rewards received will be close to the intended market benchmark when expected performance is delivered, and that remuneration will be greater or lesser when performance is above or below expectations. Other approaches cannot come close to achieving this, and often lead to misalignment in expectations of various stakeholders, confusion and poor performance/reward alignment as demonstrated in these models. GRG has been developing such frameworks for decades and can support your team to improve variable remuneration frameworks, and communicate them effectively to stakeholders.