
We define best and market practices in the mix of STIs and LTIs for executives, discuss the differences between them, and look at how boards can act to address the issues.
GRG Remuneration Insight 181
29 September 2025
The purposes of this Insight
- Specify best practice in relation to the mix of short term incentives (STI) and long term incentives (LTI) for executives,
- Consider market mix practice by reference to median target levels of STI relative to LTI,
- Discuss variations in the mix between best and market practices of executive incentive remuneration,
- Discuss deferral of STI into equity and whether it is a valid substitute for LTI, and
- Identify where remedial action should be considered by boards.
Best Practice Mix of STI and LTI for Leadership Roles
GRG has long held the view that best practice for the mix of incentive remuneration elements should be as follows. Mix refers to the proportion of total incentives that is represented by STI and LTI. It does not refer to the incentive opportunity value which is usually expressed as a percentage of Fixed Pay and tends to grow as company size increases.
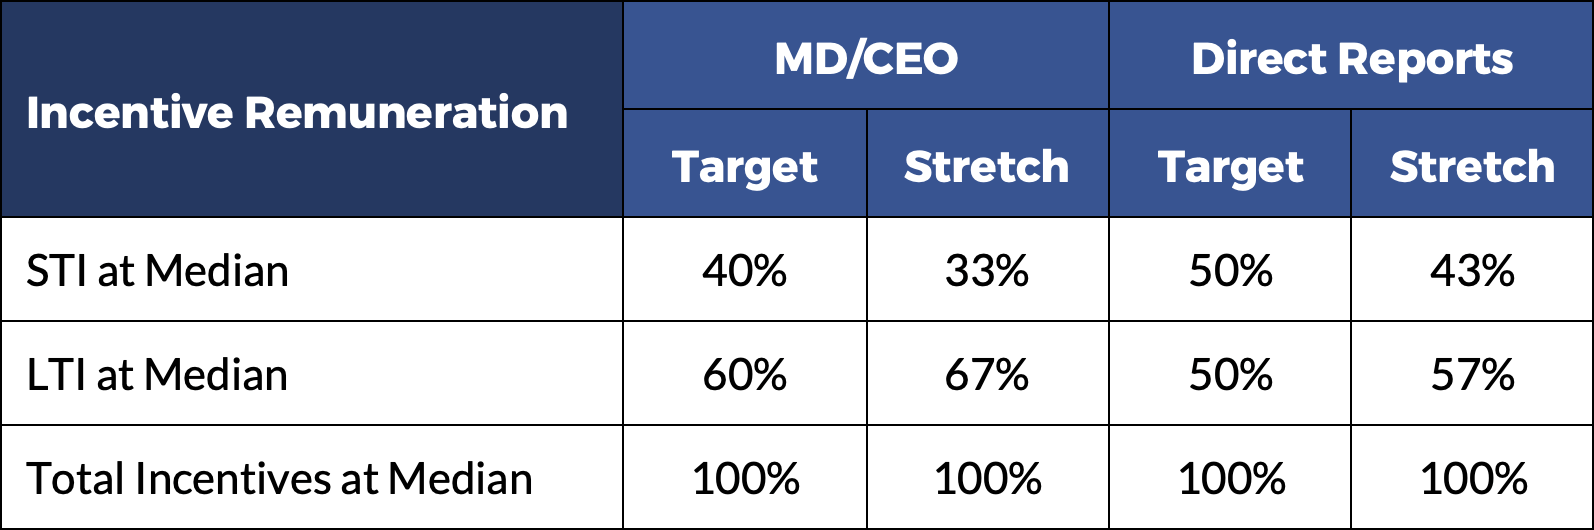
The mix proportions differ at target and stretch due to stretch levels of STI being typically 125% to 150% of the target level whereas LTI stretch is typically 200% of the target level.
Logically the focus should be on the target levels when setting the mix of executive incentive remuneration elements as this is the most likely outcome whereas the stretch (or maximum) level should be a rare event occurring less than 10% of the time.
If companies benchmark their total remuneration practices against stretch market practice and have a stretch STI award opportunity set at 150% of the STI target, then the foregoing table indicates that the mix of STI and LTI at stretch should be much more heavily weighted on the LTI element. Otherwise, the mix at target will be skewed towards the STI element.
GRG takes the view that the MD/CEO role should generally have the greatest weighting upon LTI, since this role carries primary accountability for long-term outcomes. Direct reports can more reasonably be expected to have an equal focus on short and long term performance and reward, since their accountability for long term sustainable outcomes tends to be more “contributory”, and often their accountability tends to focus on implementation of the long term strategy in each year.
STI and LTI Market Practice
GRG has undertaken analyses of market remuneration practices for three KMP/executive roles being the MD/CEO, Chief Financial Officer (CFO) and Chief Operating Officer (COO). Analysis focussed on the weighting between STI, (including deferred amounts), if applicable, and LTI at target and stretch amounts.
Direct Report Roles – CFO and COO
The following tables relate to the two direct report roles and analyse the mix of STI and LTI.
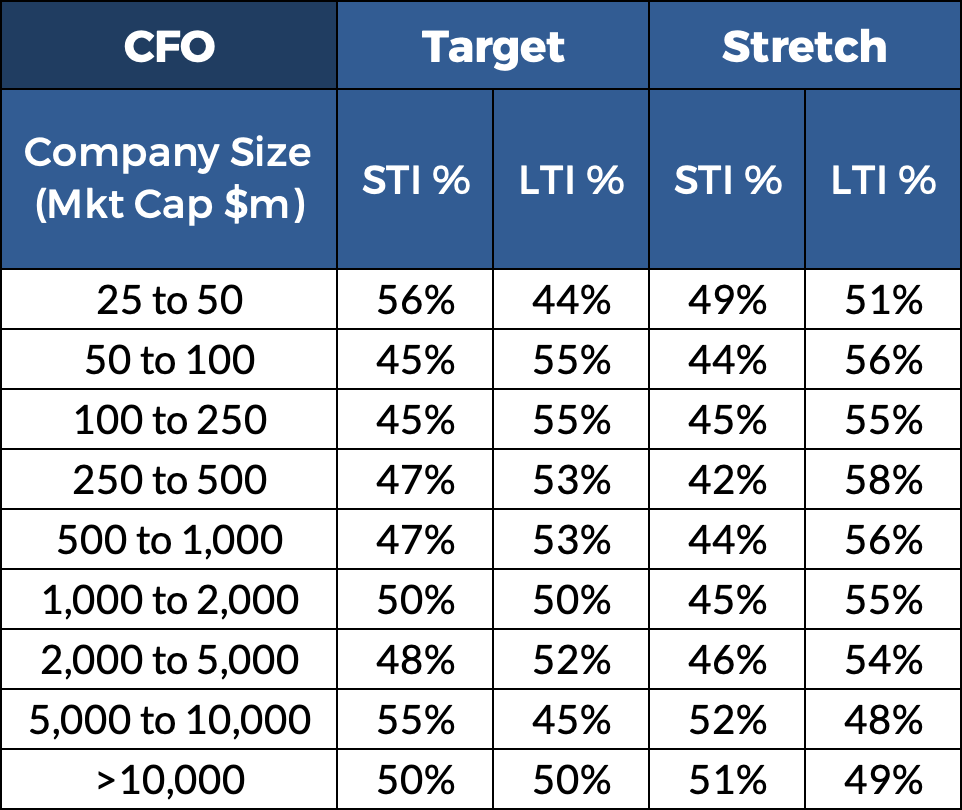
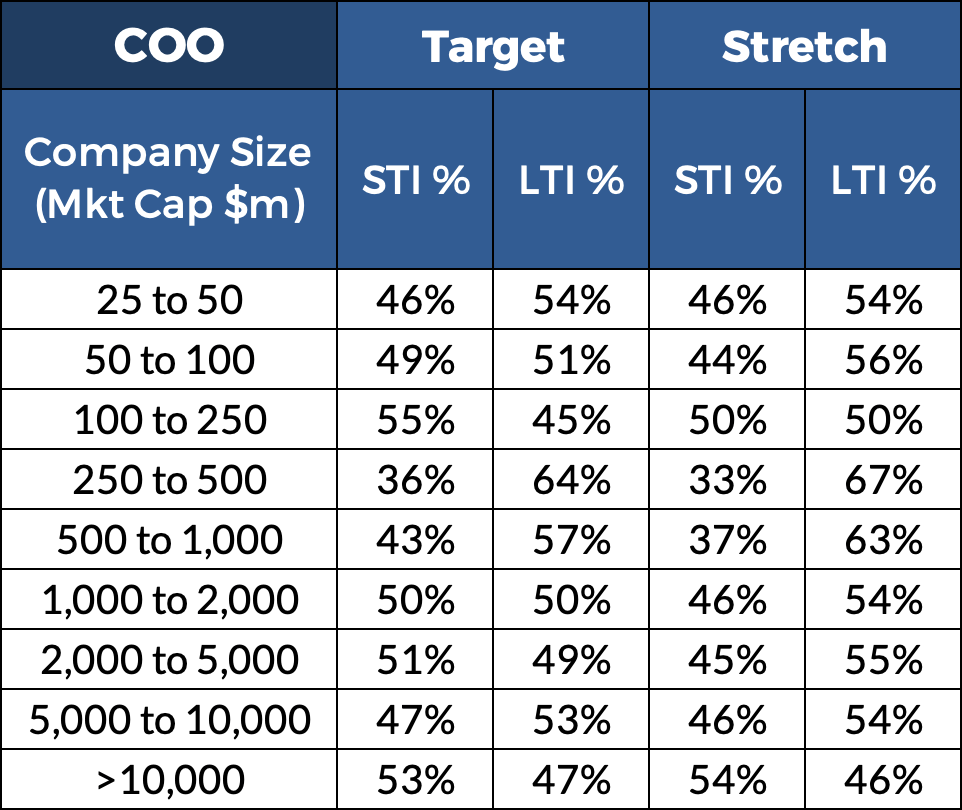
The data indicates that market practice for direct report roles tends to be close to the expected best practice mix of incentives for these roles.
MD/CEO Roles
The following table relates to MD/CEO roles. Results suggest that the mix of CEO incentive remuneration elements is not well aligned with the role’s purpose and market expectations.
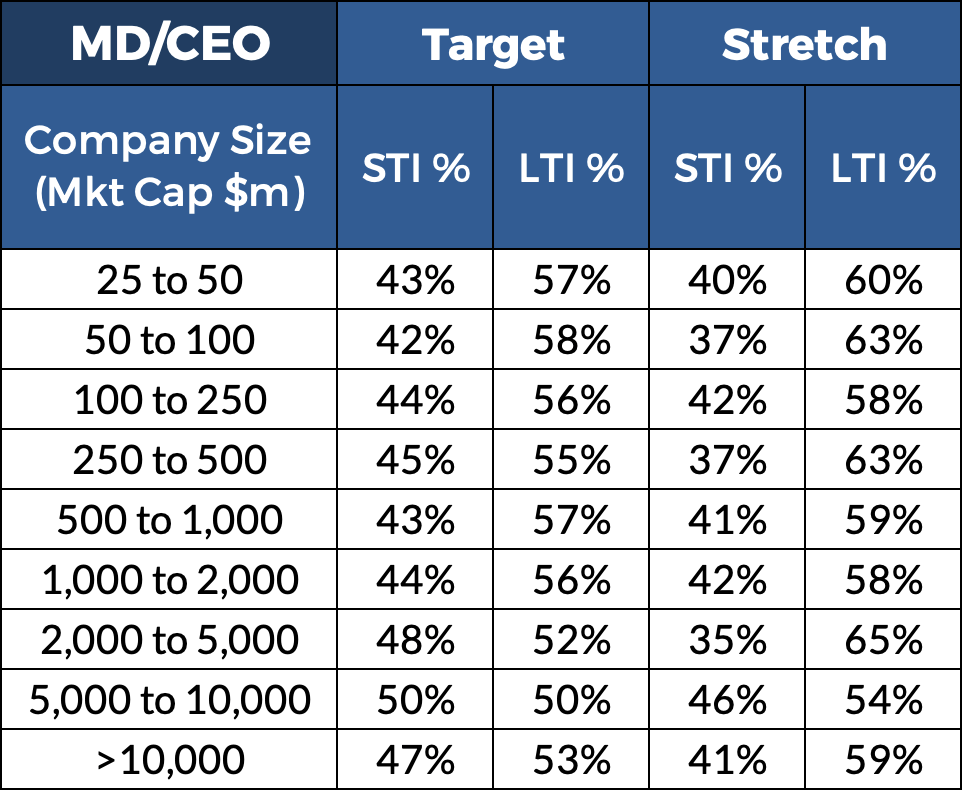
This table indicates that MD/CEO roles are being offered incentives on a similar basis to those offered to direct report roles. For example: if we consider one of the largest scale ranges ($5b–$10b), market practice is considerably close to the GRG recommended best practice for direct report STI and LTI mix.
In this regard it should be noted that given the MD/CEO has primary responsibility for the long term prosperity of the company, investors expect that role to have a significant equity stake in the company via LTI awards and deferred STI awards. Current market practice is incongruent with this philosophy.
Deferral of STI Awards vs LTI
While not a view that GRG generally agrees with, some may argue that deferral of STI awards is the same or comparable to LTI. This is generally founded on the view that it provides “skin-in-the-game” which is equivalent to holding LTI. However, this is generally a weak argument since executives are generally not required to hold that equity for any material period, and the reward does not scale up or down with long term outcomes in the same way that LTI does, only in relation to share price which is generally a much smaller variation than vesting via performance ranges. While some companies may require periods of service testing of 1-3 years on deferred STI, it is more common for short deferral periods to apply (1 year in smaller companies, 1 and 2 year tranches in larger companies) and it is increasingly common for fully vested rights to be used, since a risk-of-forfeiture is no longer a requirement to achieve tax deferral.
The following tables indicate the extent to which STI awards are deferred usually into equity. In this regard the following is noted.
- There are three distinct groups of companies that observe different STI deferral practices.
- Small companies (<$250m market cap) do little in the way of STI deferral,
- Medium to large companies ($250m to $5b market cap) report around 50% of STI awards are deferred, and
- Very large companies (>$5b market cap) report significantly more than 50% of STI awards be deferred.
- There is no difference in market practice between MD/CEO roles and direct report roles.
- The vast majority of deferred STI is subject to a service vesting condition. This aspect is notable given the information contained in Insight 176 – Court Case Triggers Review of STI Plans.


Given the mix data presented earlier for direct report roles it seems clear that STI deferral has not been treated as a substitute for LTI but this may not be the case for MD/CEO roles. In this regard it should be noted that the average tenure for incumbents of MD/CEO roles tends to be less than 7 years which understandably results in MD/CEOs having a preference for STI over LTI and for STI deferral to have a very short (typically 1 year) deferral period. Such a preference tends not to be supported by proxy advisors and other stakeholders who prefer remuneration for MD/CEO roles to have a strong weighting on long term performance thus resulting in them having significant skin-in-the-game. This can, of course, be addressed via contemporary best practice in the design of LTI plans and the deferral of STI awards.
Conclusion: Rebalancing CEO Incentive Remuneration
The lack of an appropriate weighting on LTI for MD/CEO roles creates a risk for shareholders that there may be an excessive focus on short term results leading to sub-optimal longer term performance and loss of shareholder value creation. This is an issue for boards who need to address and optimise MD/CEO remuneration structures and therefore balance all stakeholder expectations.
There are factors that have pushed market practices towards short term performance and rewards reducing the focus on long term sustainability of value creation. Many of these factors relate to poor remuneration design, leading to executives having little faith in long term rewards, and concerns about subjecting STI rewards to “double jeopardy” (via STI deferral) which remains the dominant, illogical market practice.
If the purpose of deferring STI awards is to ensure that outcomes are sustainable, by creating a pool of value from which malus and clawback can be affected, there is no need to service test them or to have long deferral periods. Executives’ concerns can be addressed, and an LTI can and should be the most attractive, exciting component of executive remuneration, when it is properly designed and calibrated against business expectations and the market. Our recent article on debugging executive remuneration provides insights into what the issues are driving short-termism in remuneration, and how to address them. Our consultants can tailor a solution for your executive team to ensure the plans are effective.
GRG’s Executive Remuneration Survey (ERS)
The data used for this analysis was extracted from GRG’s June 2025 Executive Remuneration Survey (ERS) database and focuses on policy levels of STI and LTI.
The ERS is your online executive remuneration benchmarking solution, offering data from over 1,100 companies, and more than 4,400 executives across 70 roles in Australia. The ERS provides market data for executive fixed and variable pay including a deep dive into ASX300 incentive plans, via a dynamic, intuitive, easy-to-use platform.
To arrange a free demo of the ERS or to discuss any aspect of the ERS product, please contact us.